TL;DR
This project looks at three linked questions. How can an AI data center campus be set up, from an ordinary campus to one hidden underground or inside a factory? How does each setup get rid of its heat? And how could an outsider spot it?

1. The Question
Suppose a state wants to run a frontier AI training run while an international pause is believed to hold. It already has the chips. Can it hide the data center?
This came up in a discussion about how you'd verify an AI agreement. The physics answer is that heat has to go somewhere. A big training run turns hundreds of megawatts of electricity into heat, around the clock, for months. Someone suggested you could load the heat onto trucks and drive it away.
It's a fair idea, and a little arithmetic shows its cost. Say you ship in ice and melt it on site. Absorbing one gigawatt takes about 259,500 tonnes of ice a day [1]. At the US interstate weight limit [2] that's at least 7,150 trucks a day (our estimate, a floor). A 50 MW site would still need about 360 trucks a day. That's a lot of traffic to explain.
Trucks are only one option, though. I wanted the whole menu: every way heat can leave a site, every way an outsider could notice, and a number for each pair. SIEVE is that project. The name is the question: of all the compute someone owns, how much falls through the detection sieve?
The actor is a state that allows no inspections. We assume its chips are untracked, so chip accounting gets no credit, and we size two hidden 90-day runs by power, 50 MW and 500 MW.
2. What We Built
A matrix: One axis lists 13 heat paths in 12 families, with river and sea outfalls counted apart: evaporative cooling towers, dry coolers and chillers, river and sea outfalls, deep water, borehole fields, heat and ice storage, trucked coolant, LNG regasification, district heating, industrial heat reuse and radiative sky panels. The other lists thirteen detection methods, from optical, radar and thermal imagery to grid signals, gas plumes, truck counts and on-site inspection. Each cell asks what the path emits, which sensor sees it, and how many megawatts it takes before the sensor does.
A sources ledger: Every sourced input traces to a stored, verbatim quote from its source. The exhibit's ledger holds 270 entries. Our assumptions, our arithmetic and our measurements are each labeled as ours.
A small estimate engine: It's plain Python: per-gigawatt physics, a surface heat balance, sensor noise, and revisit and cloud statistics. Every output carries the ids of its inputs, and 58 inputs are still provisional.
Thirteen field examples on real sites: Most sit around Memphis: xAI's Colossus 1 and Colossus 2, xAI's gas turbine plant across the state line in Southaven, Mississippi, and the TVA Allen power plant next door to Colossus 1. Another is a cluster of data center campuses in Ulanqab, Inner Mongolia, picked because its cold, clear climate is the best case for thermal sensing.
Imagery and records: Most data came from free archives: Landsat [3], ECOSTRESS [4], Sentinel-2 [5], TROPOMI and TEMPO [6]. We bought seven commercial images through SkyFi [7] for about $370 in total, six Vantor satellite images at 36 to 58 cm and one 6 cm Vexcel aerial photo. We also sent a public-records request to the Mississippi Department of Environmental Quality (MDEQ). It answered the next day with the full permit file for the Southaven turbines.
3. The Roof Barely Warms
Colossus 1 is a good test. Epoch AI puts it at 340 MW of IT power [8]. It sits in a former Electrolux appliance plant that stopped production in June 2022 [9], two years before xAI announced the site [10]. So we have the same roof, empty, for almost two years: a rare control.
Of 54 daytime Landsat scenes, 40 had clear views of the site and all three control roofs: 21 from the data center period and 19 from the empty period. We measured the site against a ring 1 to 3 km out, and subtracted three other large Memphis roofs to remove regional drift. What's left is a daytime step of 2.29 ± 0.33 K (our measurement, ± one standard error). At night, ECOSTRESS shows a smaller step, 1.03 ± 0.38 K (our measurement, ± SE), and no statistically resolved increase in summer.
Turning that warming into heat flow gives about 18 MW by day (90 % interval 13.5 to 22.8) and about 6.3 MW at night (2.5 to 10.2) (our estimate, Monte Carlo). The site gets rid of 408 to 931 MW: the IT load times a cooling overhead of 1.2 to 1.4, plus up to about 455 MW of waste heat from on-site turbines. So our model puts the share of the site's heat that shows up as surface warming at about 3 % by day and about 1 % at night (our estimate; 1.5 to 5.6 % and 0.3 to 2.5 % at the extremes). That share covers a 300 m circle around the site, so it includes ground and paving as well as the roof.
The measurement found a signal. Most of the heat just goes elsewhere: up as vapor from the cooling towers, up the turbine stacks, out the chiller fans. We couldn't find a published figure for this share to compare with.
4. Thermal Thresholds Are High
Feed that 1 to 3 % into the engine and ask how big a tower-cooled site has to be before Landsat flags it at a site you're already watching. One look needs about 960 MW of site heat (engine interval 342 to 2,396 MW). Ninety days of looks at Memphis need about 640 MW (228 to 1,597). Both are our estimates; the intervals are the engine's envelope over its input ranges, a bound and not a confidence interval.
Searching for an unknown site is far harder: about 3.4 GW for one Landsat look (1,050 to 12,150 MW, our estimate). Big roofs differ from each other by about 3.6 K by day (our measurement on five roofs, 68 % interval 2.8 to 6.0 K), so a warm roof doesn't stand out from its neighbors.
View chart data
| Sensor | Known site, 1 look, MW (interval) | Unknown site, 1 look, MW (interval) |
|---|---|---|
| Landsat 8/9, day | 960 (342–2,396) | 3,374 (1,050–12,150) |
| ECOSTRESS, day | 780 (278–1,946) | 2,739 (853–9,868) |
| ECOSTRESS, night | 2,736 (765–12,470) | 3,168 (848–17,780) |
| ASTER, day (past images only) | 804 (286–2,007) | 2,825 (880–10,180) |
| Hydrosat VanZyl, day | 790 (281–1,972) | 2,776 (864–10,000) |
| constellr SkyBee, day | 763 (272–1,904) | 2,680 (835–9,655) |
| constellr SkyBee, night | 2,677 (748–12,200) | 3,100 (829–17,390) |
| OroraTech FOREST-2, day | 912 (325–2,277) | 3,206 (998–11,550) |
| SatVu HotSat-2, day | 747 (266–1,864) | 2,625 (817–9,454) |
| SatVu HotSat-2, night | 2,621 (733–11,950) | 3,036 (812–17,030) |
The sensors land in nearly the same place because the limit is clutter, the ordinary scatter of a roof against its surroundings (about 1 K per daytime look, our measurement). Landsat's own noise would allow about 14 MW. If a site dumped all its heat through its surfaces, every sensor here would see about 20 to 26 MW. The cooling design sets the gap between that and 960 MW. The model scores a 300 m average, so it can't credit a sharp sensor like HotSat-2 for spotting single hot units.
Under our Colossus-calibrated model, the 50 MW tier has little detection power above the nominal false-alarm target in the scenarios we ran: its chance of detection after 90 days is 0.001 to 0.004. The 500 MW tier gets 0.28 with Landsat in Memphis (interval 0.01 to 0.99) and 0.75 at Ulanqab (0.04 to 1), our estimates.
5. Counting Works
Thermal is the weak method. Cameras do much better, because the hardware that moves heat is big, regular and outdoors. A gigawatt of air-cooled chillers is about 500 units [11]. A gigawatt of cooling towers is 125 to 143 cells (our estimate from [11]).
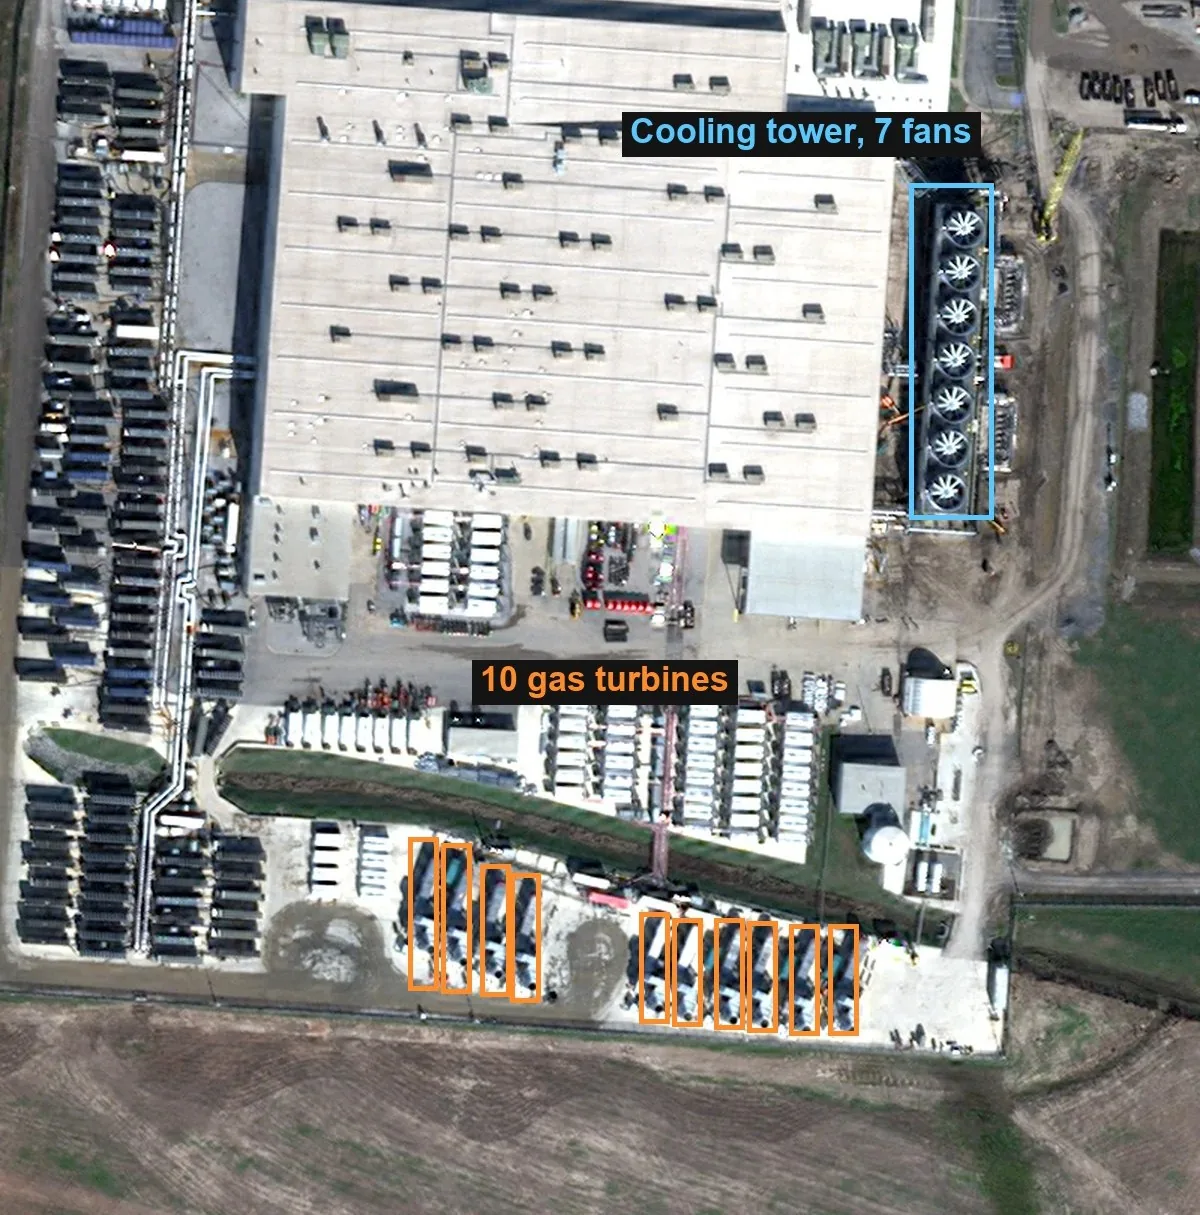
Turbines at Colossus 1: On a $20.72 Vantor image of 28 November 2025, at 50 cm, we count 12 turbine packages: 10 in the south yard and 2 in a north row (our measurement). The construction permit allows 15 [12]. An April 2026 request asked for 12 [13]. Free 10 m Sentinel-2 images can't count a single unit, since a turbine trailer is under half a pixel wide.
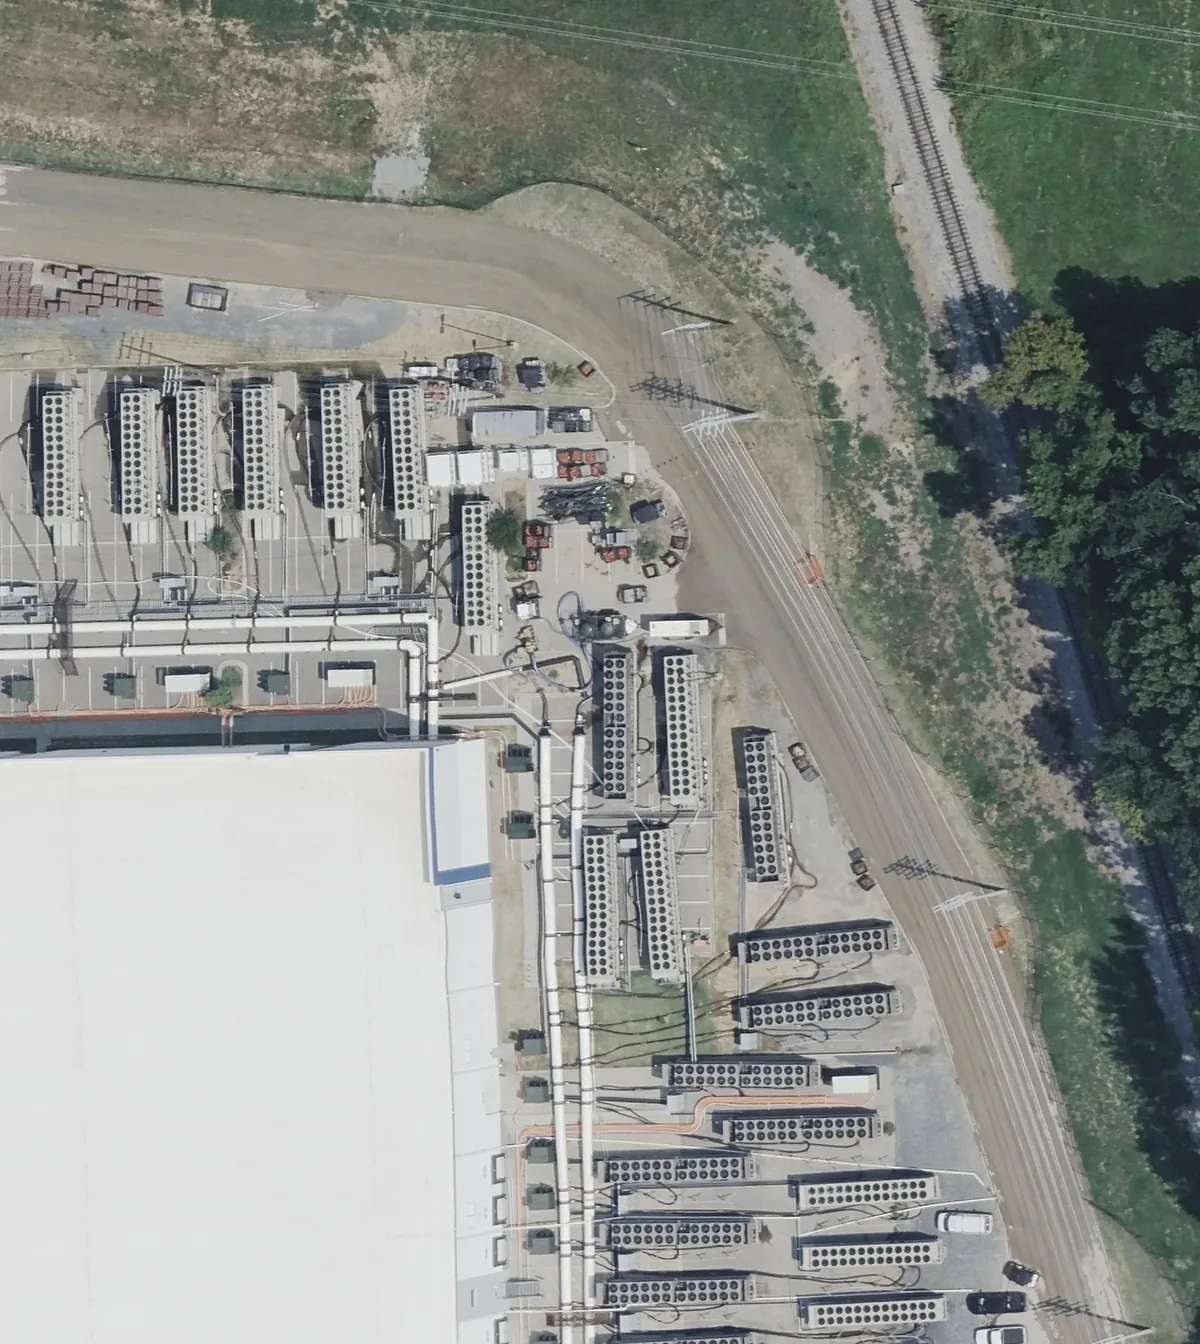
Chillers at Colossus 2: On a 6 cm Vexcel aerial photo of 4 August 2026, we count 218 air-cooled chillers (our measurement, ± 4 as a judgement, not a statistical interval). Epoch AI's current table lists 217 [14]. On a 39 cm satellite image a month later, 214 of the 218 were still in place. Turning a count into megawatts carries Epoch's stated error of up to a factor of two either way [15]. That's still far better than a 2 K warm roof.
Records at Southaven: Mississippi's Agreed Order with xAI's affiliate lists 69 mobile turbines, one row each, with the date each arrived and is due to retire [16]. MDEQ's file added the amended list [17] and the bi-weekly removal reports. We rebuilt the fleet day by day and checked it against every dated outside count: of 21 checks, 15 match, 4 don't, 1 can't be checked and 1 covers a different scope (our measurement). One mismatch is a removal report that left out two units due to stop [18]. The list bounds what may run. It can't show what did run.
6. Vapor Plumes
Wet cooling towers make visible plumes in cold, humid air, so we looked. On 18 clear winter mornings in Sentinel-2, the TVA Allen gas plant's tower 1.2 km away showed a plume on 7, all at 8.3 °C or colder with the plant making 623 MW or more [19] (our calls, by eye). Colossus 1 showed nothing on any of the 18. Ten of those mornings came after its tower went up, and four of the ten were at 5 °C or colder.
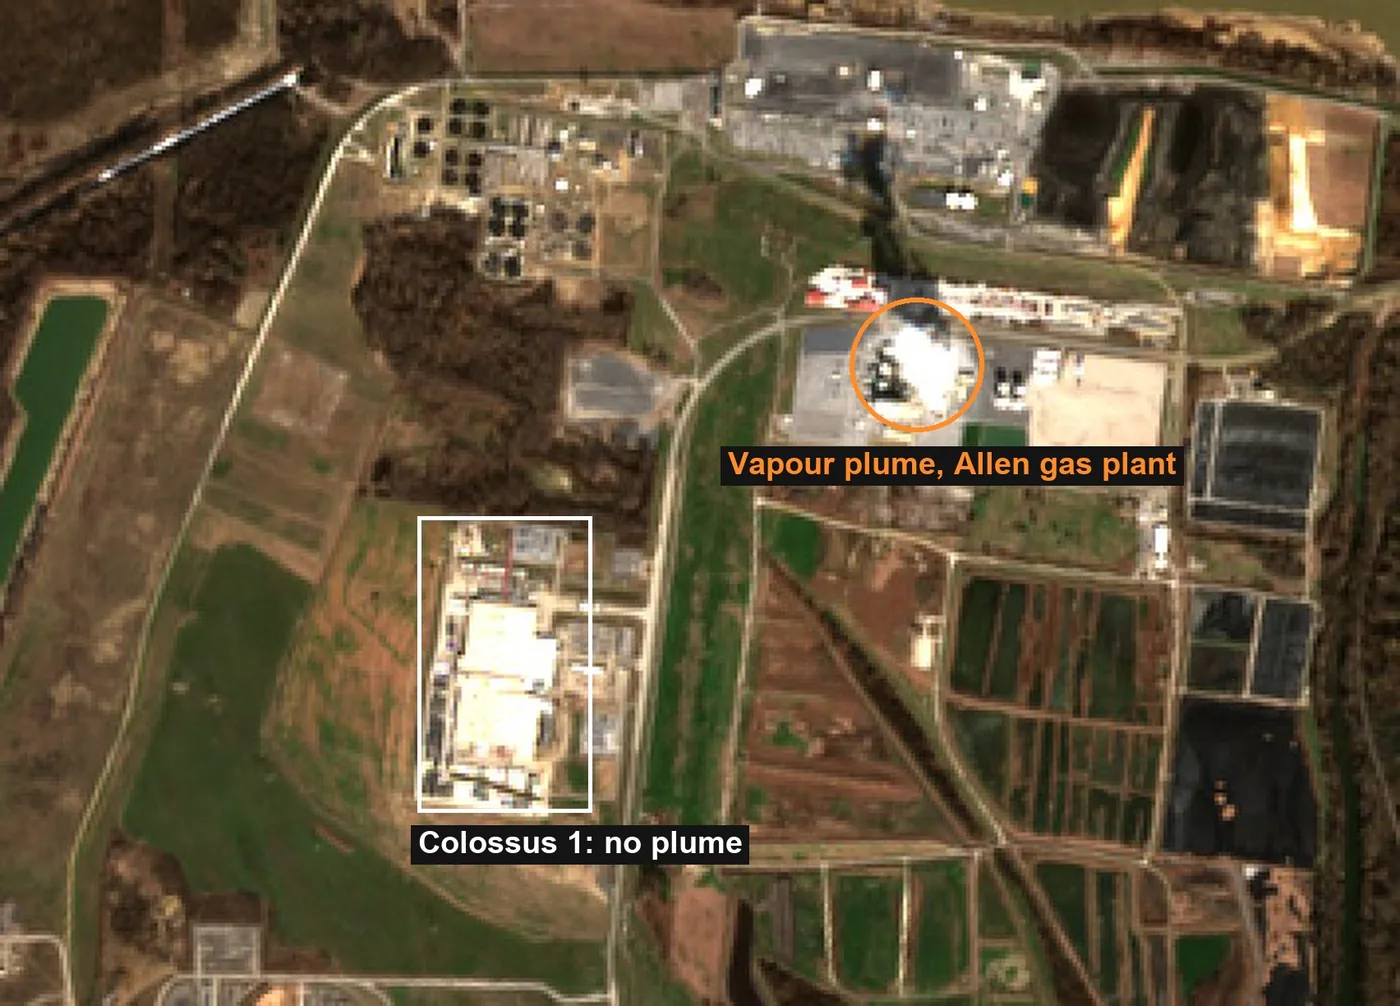
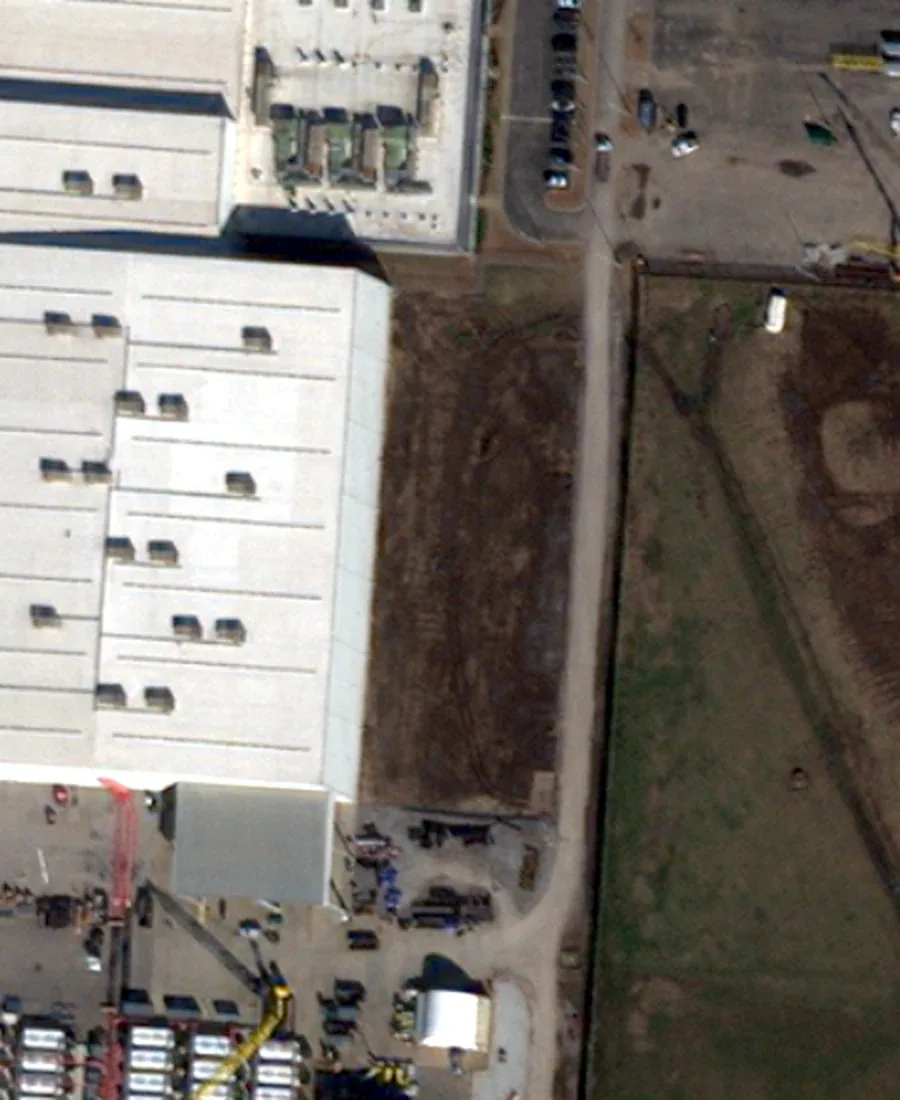
We can't read much into the blank. At Allen, cold mornings were also busy mornings, so the sample can't separate temperature from load. At Colossus 1 we don't know whether the tower was running, or whether its plume was too thin for 10 m pixels against a white roof. Commercial imagery did settle one smaller question: when the tower went up.
7. Ulanqab: The Best Case for Thermal
If thermal sensing works anywhere, it should work in Ulanqab: clear, dry and cold, with winters when data centers can cool with outside air. We drew eight campus outlines by hand and ran the Memphis method on Landsat by day and ECOSTRESS by night. The before state here is farmland, so we compared against an industrial park nearby.
Against the park, Huawei's campus reads +1.09 ± 0.26 K on winter days (13 scenes) and −0.30 ± 0.19 K on winter nights (our measurement, ± SE). Keeping the snowy scenes halves the daytime gap. For Huawei, winter didn't bring out a warm roof that summer hides. Some other comparisons do show warmth: on autumn nights, against the same park, the unlabelled centre reads +2.09 ± 0.26 K over 4 passes and Yueke +1.38 ± 0.20 K over 12 (our measurement, ± SE). That's warmth we observed. Nothing yet ties it to servers.
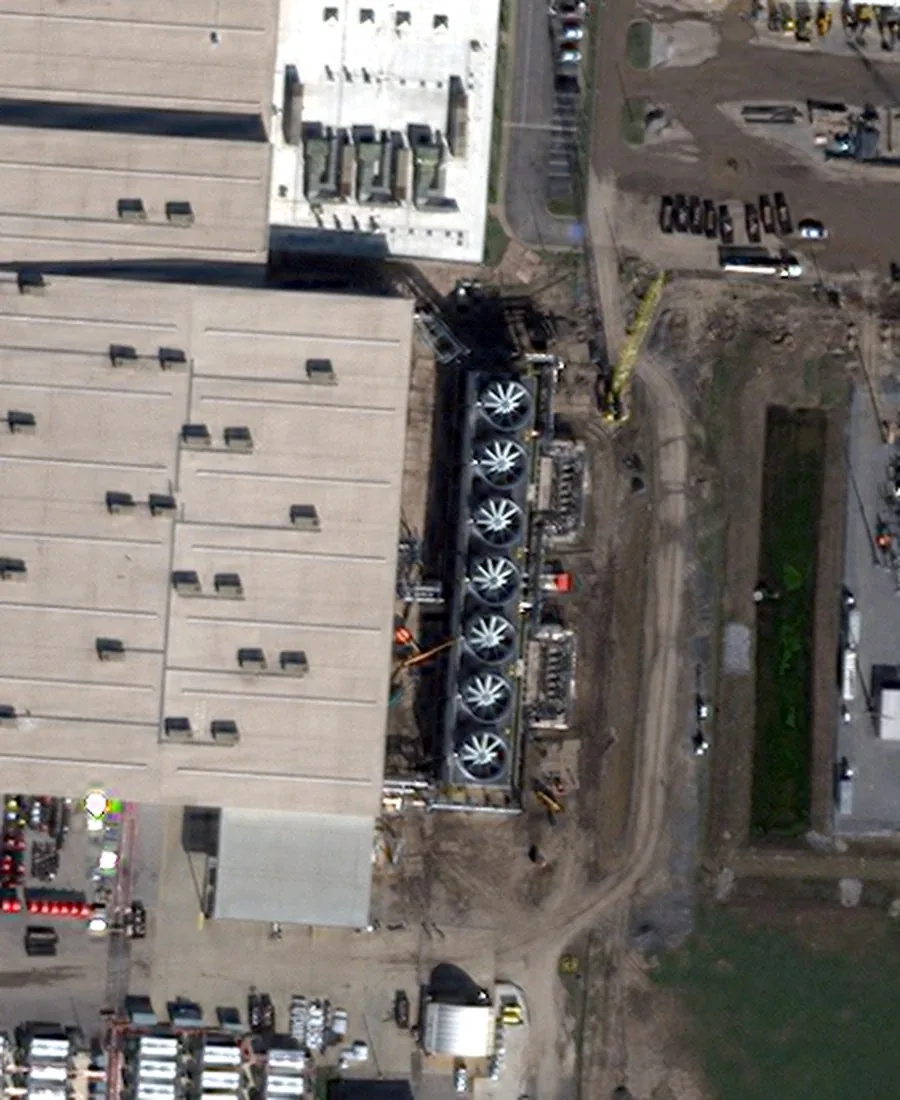
One 36 cm Vantor image of 5 March 2026 covers all eight campuses for $80.46, and it shows why that's plausible. Seven of the eight campuses show no cooling towers. Only Huawei's newest hall has tower-like cells, 12 of them. Everything else we can see is fan-driven air units (our reading). We can't say which of them run, and we know the load of no campus, so we give counts and no megawatts.
8. Gas Plumes and Trucks
Sites that burn gas for power show up in a different sensor. Within 5 km of the Southaven turbines, TROPOMI's NO₂ above a rural background rose by 11.3 ± 3.2 µmol/m², or 29 ± 8 % (our measurement, ± SE). TEMPO agrees: +11.7 ± 3.4, against +0.3 ± 2.9 downtown. The TVA plant next door emitted 20.0 kg/h of NOx before and 20.4 after in the overpass hours, per EPA's stack data [19], so a rise in its emissions doesn't explain the increase. Wind can still change how much of its plume reaches the area we sampled. Colossus 1 shows no clear change (+1.0 ± 1.5).
A preprint by Gauld and others [20] turns TEMPO data into an emission rate for the Southaven plant: 730 ± 185 kg/h of NOx after February 2026 (± SD of two-week estimates), a satellite estimate. MDEQ's file holds the consultant's own NOx rates for 32 of the portable turbines [21]. At full load they sum to 336 kg/h (our sum). The satellite figure is about twice that, before counting the 27 units with no rates. The two aren't like for like yet: one is a multi-month satellite estimate, the other a full-load sum for part of the fleet. We obtained no measured stack-test results. SMT-130 units were tested on 10 to 16 September 2026, but the results weren't in the file, and stack monitors for the permitted turbines have no start date.
Logistics turned out weaker than I expected. Our vehicle detector, checked by a person, kept 36, 368 and 229 vehicles at Colossus 2 on three dates as it was built. Cars rose from 23 to 360, a real trend. But in hand-labeled test windows the detector found only 9 of 60 trucks. These counts track a construction workforce. Nothing ties them to megawatts, so the engine gives logistics no MW threshold.
9. Limits
One calibration site: The surface share, the clutter and the roof-to-roof spread all come from Memphis. Ulanqab couldn't calibrate the share, because no campus load is known. A dry-cooled site with public load data would be the next test.
Reported load: Colossus 1's 340 MW is Epoch AI's capacity estimate, not metered use, and it changed while we measured. Epoch's timeline shows 278 MW in early 2025, 340 MW from July, 268 MW in September and October, and 340 MW again from November [8]. We divided temperature changes spanning 2025 and 2026 by one current figure, so the surface share carries that error. We also don't know which turbines ran on any date.
Emissivity: Near room temperature, under the simple radiance model in [22], a 1 % change in a roof's emissivity shifts its apparent temperature by about 0.7 K. That's a rough guide, not the error in processed Landsat or ECOSTRESS temperatures. The Colossus 1 roof was resurfaced, and Sentinel-2 shows it got 31 % brighter in visible light. Visible brightness doesn't measure a change in thermal emissivity, and we haven't checked how the thermal products handle the new surface.
A simple model: The engine treats the roof as a steady heat balance, with no thermal inertia or plume model.
False alarms: The rule set for 0.1 % false alarms fired on 1 of 142 held-out tests, or 0.70 % (nominal 95 % interval 0.02 to 3.9 %). The tests share fitted baselines, so the real uncertainty is wider. This sample can't validate the target rate.
First measurements: Each count is one person's reading of one image. The NOx gap rests on a preprint and on company estimates. We didn't measure a third target near Guiyang. The hardest case is compute inside a smelter or power plant that shares its host's power, cooling and emissions. The literature discusses industrial concealment, but we found no validated detection model for that case, and our engine computes nothing for it.
Live Demo
 Interactive exhibit
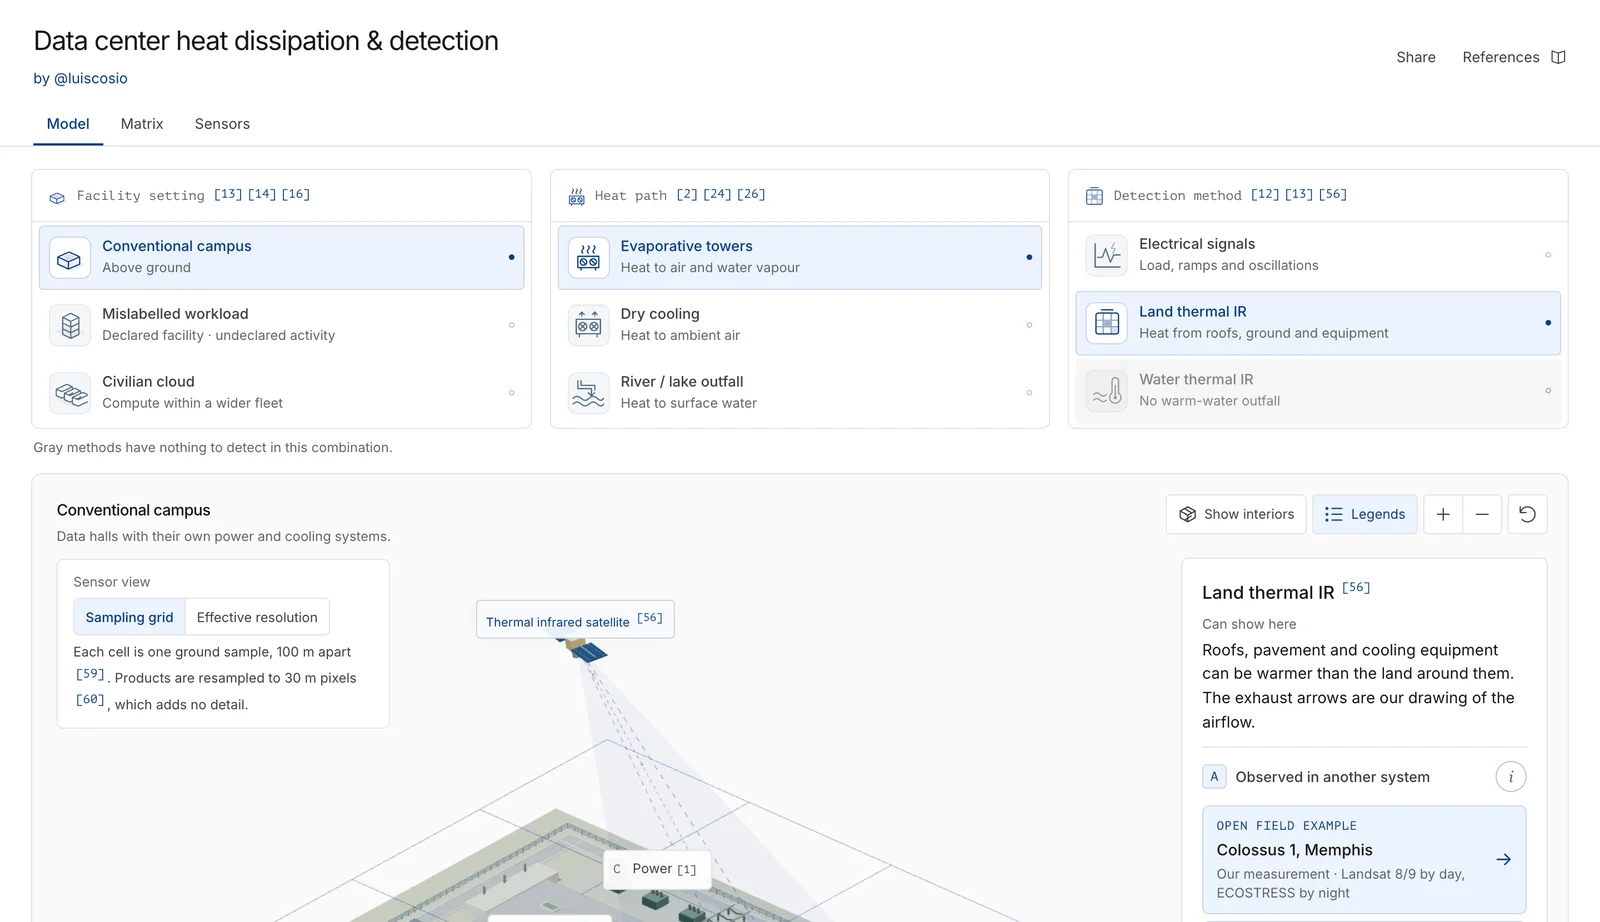
Pick a campus setup, a heat path and a sensor, and watch what each one can see
A 3D model of each setup, the heat path × detection matrix, a table of what each sensor can catch, and all 13 field examples with their data.
Interactive exhibit
Pick a campus setup, a heat path and a sensor, and watch what each one can see
A 3D model of each setup, the heat path × detection matrix, a table of what each sensor can catch, and all 13 field examples with their data.
Everything in this post is in the exhibit [23], with its method notes and the full sources ledger.
References
- University of Wisconsin–Madison, Department of Chemistry (General Chemistry netorial), “Heat of Fusion,” course web page, Thermodynamics module, n.d. (accessed 2026-10-06). [Online]. Available: https://www2.chem.wisc.edu/deptfiles/genchem/netorial/modules/thermodynamics/enthalpy/enthalpy4.htm
- US Federal Highway Administration, Office of Freight Management and Operations, “Commercial Vehicle Size and Weight Program,” FHWA web page, n.d. (accessed 2026-10-06). [Online]. Available: https://ops.fhwa.dot.gov/freight/sw/overview/index.htm
- USGS, “Landsat 9,” Mission page, accessed 2026-10-05, n.d. [Online]. Available: https://www.usgs.gov/landsat-missions/landsat-9
- eoPortal, “ISS: ECOSTRESS,” 2021. [Online]. Available: https://www.eoportal.org/ftp/satellite-missions/iss/ISS-ECOStress_300721/ISS-ECOStress.html
- Copernicus SentiWiki, “S2 Mission,” 2025. [Online]. Available: https://sentiwiki.copernicus.eu/web/s2-mission
- NASA Atmospheric Science Data Center, “TEMPO gridded NO2 tropospheric and stratospheric columns V04 (PROVISIONAL),” Collection TEMPO_NO2_L3 version V04. doi:10.5067/IS-40e/TEMPO/NO2_L3.004. Accessed 2026-10-06, 2025. [Online]. Available: https://doi.org/10.5067/IS-40e/TEMPO/NO2_L3.004
- SkyFi, “FAQs,” n.d., accessed 2026-10-05. [Online]. Available: https://www.skyfi.com/faqs
- Epoch AI, “Colossus 1,” AI data centers directory, accessed 2026-10-05. [Online]. Available: https://epoch.ai/data/ai-data-centers/directory/colossus-1
- Electrolux Group, “Electrolux Group to divest Memphis factory,” Press release via PR Newswire, 21 Sep 2023. [Online]. Available: https://www.prnewswire.com/news-releases/electrolux-group-to-divest-memphis-factory-301934371.html
- M. Wicks, T. Haywood, and B. Bolden, “Elon Musk's xAI to build multi-billion-dollar supercomputer project in Memphis,” Action News 5 (WMC), 5 Jun 2024. [Online]. Available: https://www.actionnews5.com/2024/06/05/elon-musk-build-multi-billion-dollar-ai-supercomputer-project-memphis/
- J. E. Ontiveros, D. Patel, D. Nishball, and R. Knuhtsen, “Datacenter Anatomy Part 2 – Cooling Systems,” SemiAnalysis newsletter, 13 Feb 2025. [Online]. Available: https://newsletter.semianalysis.com/p/datacenter-anatomy-part-2-cooling-systems
- Shelby County Health Department, “Construction Permit No. 01156-01PC,” Issued to CTC Property LLC, 2 Jul 2025, expires 2 Jan 2027. Scan published on Scribd. [Online]. Available: https://www.scribd.com/document/883601734/01156-01PC-070225-Permit
- Daily Memphian, “MD113657,” Public notice, 6 Apr 2026. [Online]. Available: https://dailymemphian.com/article/61605/md113657
- Epoch AI, “Colossus 2,” AI data centers directory, updated 2 Oct 2026. [Online]. Available: https://epoch.ai/data/ai-data-centers/directory/colossus-2
- Epoch AI, “Frontier Data Centers – Documentation – Methodology,” Frontier Data Centers documentation (web page), 2025. [Online]. Available: https://epoch.ai/data/data-centers-documentation/methodology
- Mississippi Commission on Environmental Quality, “Agreed Order No. 7739 26,” MZX Tech LLC, 2875 Stanton Road, Southaven, MS. Ordered 30 Jul 2026. 10 pp. [Online]. Available: https://opcgis.deq.state.ms.us/ensearchonline/get_doc.aspx?dt=order&id=1862315
- Mississippi Commission on Environmental Quality, “Amendment to Agreed Order No. 7739 26,” Public records response, Mississippi DEQ, received 2026-10-07. Ordered 11 Sep 2026, 9 pp. (scanned), with Attachment A, Amended Appendix A, on pp. 6–9.
- Trinity Consultants for MZX Tech LLC, “MZX Tech LLC - Bi-Weekly Turbine Removal Report #2 for Commission Order 7739 26,” Public records response, Mississippi DEQ, received 2026-10-07. Email to MDEQ, 26 Aug 2026, 1 p.
- U.S. Environmental Protection Agency, Clean Air Markets Program Data (CAMPD), “Facility attributes and apportioned hourly emissions API services,” Facilities 55269 and 3393, 1 Jan 2022 to 30 Jun 2026, accessed 2026-10-06. [Online]. Available: https://api.epa.gov/easey/
- K. D. Gauld, D. J. Varon, N. Balasus, and D. H. Cusworth, “Quantifying AI data center nitrogen oxide (NOx) emissions from space,” arXiv preprint 2608.22153 [physics.ao-ph], v1 23 Aug 2026, v2 15 Sep 2026. [Online]. Available: https://arxiv.org/abs/2608.22153
- Trinity Consultants for MZX Tech LLC, “Updated Count & Emission Profiles,” Public records response, Mississippi DEQ, received 2026-10-07. Email to MDEQ, 15 May 2026, with attachment "2026-0514 Temporary Turbine Emissions" (4 pp.); 6 pp. in all.
- H. Zhang and F. N. von Hippel, “Using Commercial Imaging Satellites to Detect the Operation of Plutonium-Production Reactors and Gaseous-Diffusion Plants,” Science & Global Security 8 (2000): 219–271. [Online]. Available: https://scienceandglobalsecurity.org/archive/sgs08zhang.pdf
- L. Cosio, “Data center heat dissipation & detection,” interactive exhibit, Oct. 2026. [Online]. Available: https://luiscosio.github.io/sieve/
Cite This Post
L. Cosio, “SIEVE: Can an AI data center hide its heat?,” luiscos.io, Oct. 9, 2026. [Online]. Available: https://www.luiscos.io/blog/sieve/